
Projects
|
Bloom
Steve Castellotti Brain Scan Mike Pesavento Calibration Station Alexis Finch, Robert Hanson, Peter Tjeerdsma, William Wnekowicz Central Infrastructure James Bobowski, William Wnekowicz Change Your Mind Lincoln Nguyen, Mike Pesavento, Paul Sukhanov, Watson B. Watson CloudBrain Marion Le Borgne, Madeeha Ghori, Dave Silva, William Wnekowicz Glass Brain On loan courtesy of The Gazzaley Lab |
Lateral Inhibition
Caroline Margaux, Madeeha Ghori, Shane Sischo Mindscape Juan Miguel de Joya, Victor Leung, Kelly Peng Make it Move Pierre Karashchuk, John Naulty, Tomás Vega Jon Ferran, Alex Nolan No Magic Here Tiffany Barr, James Bobowski Pieces of Mind Mike Pesavento Puzzling Evidence Tiffany Barr, James Bobowski, Brian Krawitz, Shane Sischo Save the Brain Mike Pesavento The Mind’s Eye Natalia Bilenko, James Gao |
|
Bloom
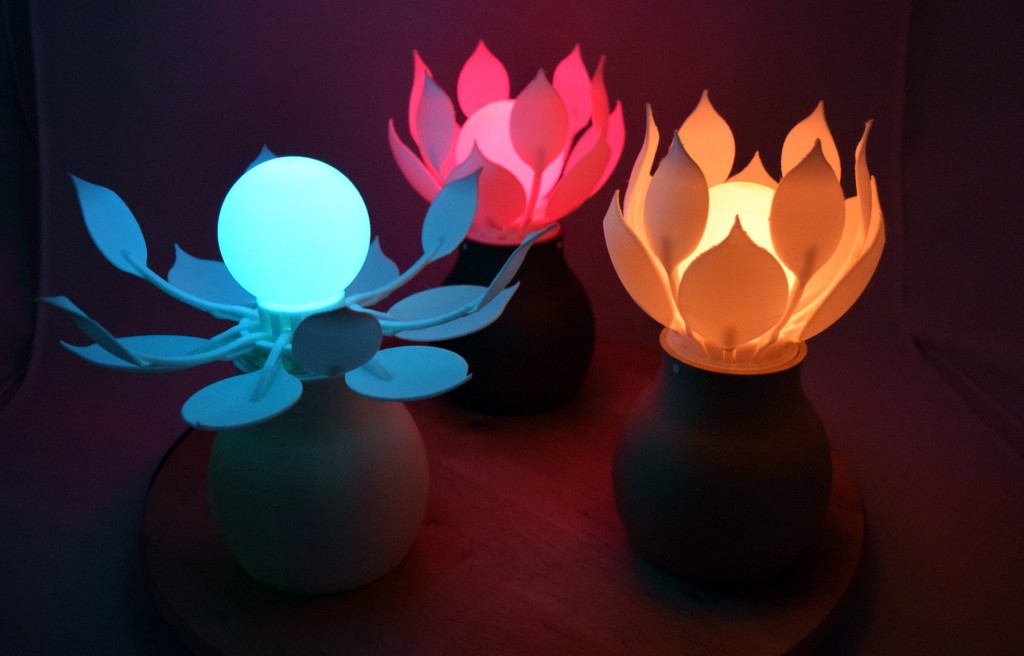
Steve Castellotti The Bloom uses an artistic form of neurofeedback to train mental relaxation through mental exercises measured by an EEG headset. The colors change to reflect your progress, and the flower design slowly opens as you approach your goals. The Bloom Flower translates the brain wave data coming through your headset into colors and movement. When you concentrate and relax, the flower changes color and slowly opens. |
Neurofeedback Art
Researchers use EEG headsets to measure brain activity. This information can be used to teach users how to calm or relax their mental state. This process is called neurofeedback. |
|
Brain Scan
Mike Pesavento Mapping the brain allows us to better understand how it works. Just as we’ve mapped out the human genome by analyzing DNA, researchers are currently mapping our brain’s nearly 100 billion neurons and the synaptic connections among them. Every neuron is connected to from 1,000 to 10,000 other neurons, creating a dense network called the connectome. Together, these connections make up what we experience as memory, consciousness, thought, and movement. These videos show you some of the views that more and more precise technology has enabled us to see. |
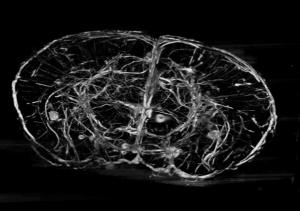
High-resolution tissue scanning
The mouse cortex in this exhibit was scanned using a “Knife Edge Scanning Microscope.” First, it slices off a very thin piece of brain tissue (only one micron thick, or 1/25,000 of an inch). It uses an optical microscope to scan the slice of tissue. After all of the brain tissue has been sliced and scanned, machine vision software will reconstruct a 3D model of the tissue and identify the areas that are blood vessels, neurons, or glial cells. |
|
Calibration Station
Alexis Finch, Robert Hanson, Peter Tjeerdsma, William Wnękowicz Knowing when you’re sufficiently relaxed is tricky. As soon as you start wondering if you’re relaxed you’ve lost your moment of concentration. By giving you something visual to focus on, you won’t need to think about your progress. Quantifying meditation and its benefits has been a challenge since you cannot measure the strength of someone’s relaxation the same way you can measure how much weight they can lift or how fast they can run. EEG headsets give a glimpse into your brain’s workings and have given researches some much-needed measurements. Through the data that’s been gathered, it is now possible to say that meditation practices do in fact change how the brain works. |
|
Central Infrastructure
James Bobowski, William Wnękowicz This exhibit requires the centralization and routing of data coming from visitor interactions with each experience. While wearing one headset throughout the entire exhibition you can enter an immersive world, where the headset becomes a neural prosthetic— and a part of you. We developed a realtime networking infrastructure for EEG data and other biosensor devices. Learn More The infrastructure repository is available online: https://github.com/flysonic10/muse-manager |
|
Change Your Mind
Lincoln Nguyen, Mike Pesavento, Paul Sukhanov, Watson B. Watson Measure your heart rate and brain wave activity, and see how they correspond to your emotional state. While the EEG headset monitors brain activity, the ECG—a heart rate sensor—monitors changes in the visitor's heart rate. Changing your breathing can help calm and relax you, affecting your mental state (more relaxed) and altering your heart rate variability (HRV), a metric for general health. Reaching a state of relaxation influences both your brain and heart. Providing visual feedback of your progress during the breathing exercise makes it easier to reach a relaxed state. With practice over time you’ll be able to reach a state of relaxation faster, which in turn will help with your overall physical and mental health. |
Biofeedback
Neural activity (and our subjective experience of the world correlated with it) is a complex dynamical system of billions of interacting components, lying outside of the complete conscious control of human beings. However we can intentionally choose to engage in exercises such as coherent slow breathing and meditation -- which bring us into states of joy, stability, clarity and relaxation and improve our health. How do dynamic biological signals sampled non-invasively at the forebrain (EEG) and the palms (ECG) reflect these changes? In this booth we look at how alpha frequency band EEG power and degree of variability in heart rate (HRV) correspond to experienced changes in state after engaging in intentional practices. Doing so allows us to understand the capacity we have to modify our own mental state and, simultaneously, our ability to sense this state and the changes associated with it. a |
|
CloudBrain
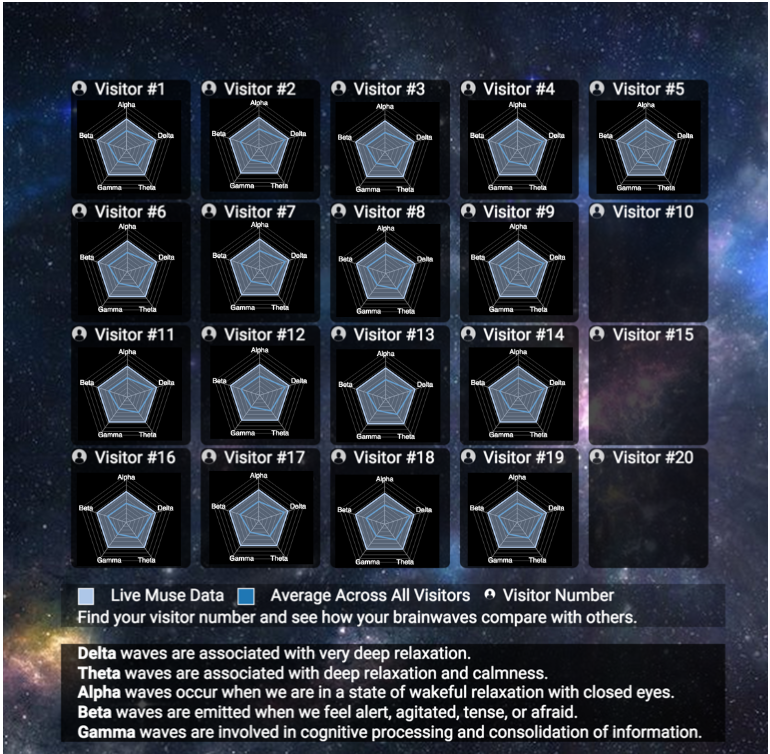
Marion Le Borgne, Madeeha Ghori, David Silva, William Wnękowicz In order to better understand the brain and mental health, we aim to develop tools for large-scale data aggregation and analysis of biodata from many subjects. We created a platform for real-time biodata interaction, data analysis, and visualization. The aggregate data of visitors has been analyzed programmatically and can be viewed in real time, showing how an individual’s brain patterns shift and change as they interact with each experience. Learn More CloudBrain is an open source platform for real-time biodata data analysis and visualization. See the code here: https://github.com/marionleborgne/cloudbrain |
|
|
Glass Brain
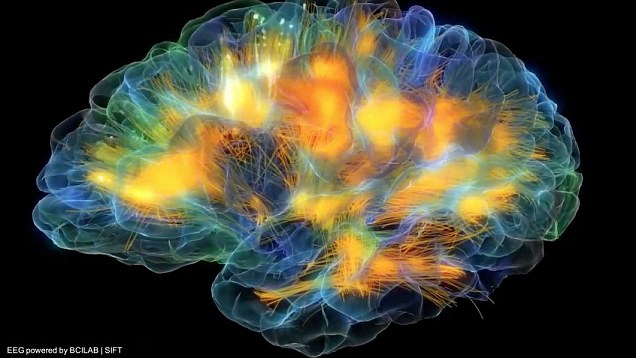
On loan courtesy of The Gazzaley Lab at UCSF Your brain is made up of specialized tissues that react differently to outside stimuli. The brain contains different types of tissue. Grey matter is primarily associated with processing and cognition. White matter acts more like a communications director, passing signals from one area of grey matter to the next. The white matter in this 3D rendering is shown in gold, forming the bulk of the deep parts of the brain and the superficial parts of the spinal cord. The transfer of information between regions of the brain is visualized as light pulses. In the Glassbrain visualization, each color represents the electricity moving at different frequencies (named delta, theta, alpha, beta, and gamma) through different regions of the brain. This 3-D visualization was created through a combination of data from MRI (magnetic resonance imaging), EEG (electroencephalography) and DTI (diffusion tensor imaging), and shows how the brain reacts to outside stimuli. |
|
|
Lateral Inhibition
Caroline Margaux, Madeeha Ghori, Shane Sischi “Lateral Inhibition” is an art sculpture that demonstrates the that neurons in your eye send information to the visual cortex. We sought to reduce the complex functionality of neural computation into a visually intuitive display. In the brain, clusters of neuron cells send impulses from demonstrates the transition from low-level sensory information to higher-level representations in the brain. In this sculpture, you can see how signals spread from one layer of neurons on to the next. You will notice how one neuron is able to trigger many others that are connected to it simultaneously. This process also explains how we are able to differentiate shapes and depth of field. When there is a difference in the value of the signal between two neurons, they emphasize that difference as they propagate that signal outward. This is what makes 'edges' sharp in our vision. |
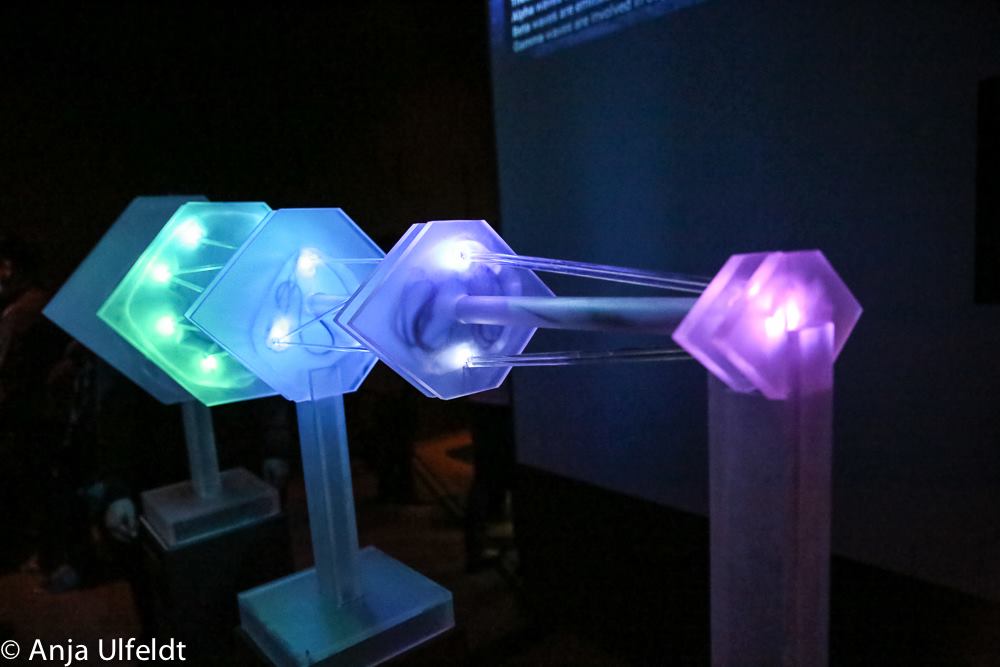
Understanding the biology behind “Lateral Inhibition”
Lateral inhibition allows you to see the edges of objects more clearly. The visual cortex is one of the most studied and understood is the visual cortex in the back of the brain. Here, the information taken in by our eyes is processed and translated into what we experience as ‘sight.’ Knowing how this area of the brain works has allowed researchers to better understand other parts of the brain. |
|
Mindscape
Juan Miguel de Joya, Victor Leung, Kelly Peng This game represents an experimental, virtual-reality based form of neurofeedback. Using the EEG headsets in the exhibition, the software can detect the general level of activity in the brain. We use this information to transform the environment around you. This environment, in turn, can affect your mental state. Brainwave measurements can be used to find a rough approximation for your level of focus and attention. You can use this information to become better at keeping a focused state of mind. This process is called neurofeedback. Finding balance between concentration and relaxation is a challenge everyone faces. Being able to see your brain waves and quantify what they’re doing gives you better control over your brain, and your state of mind. |
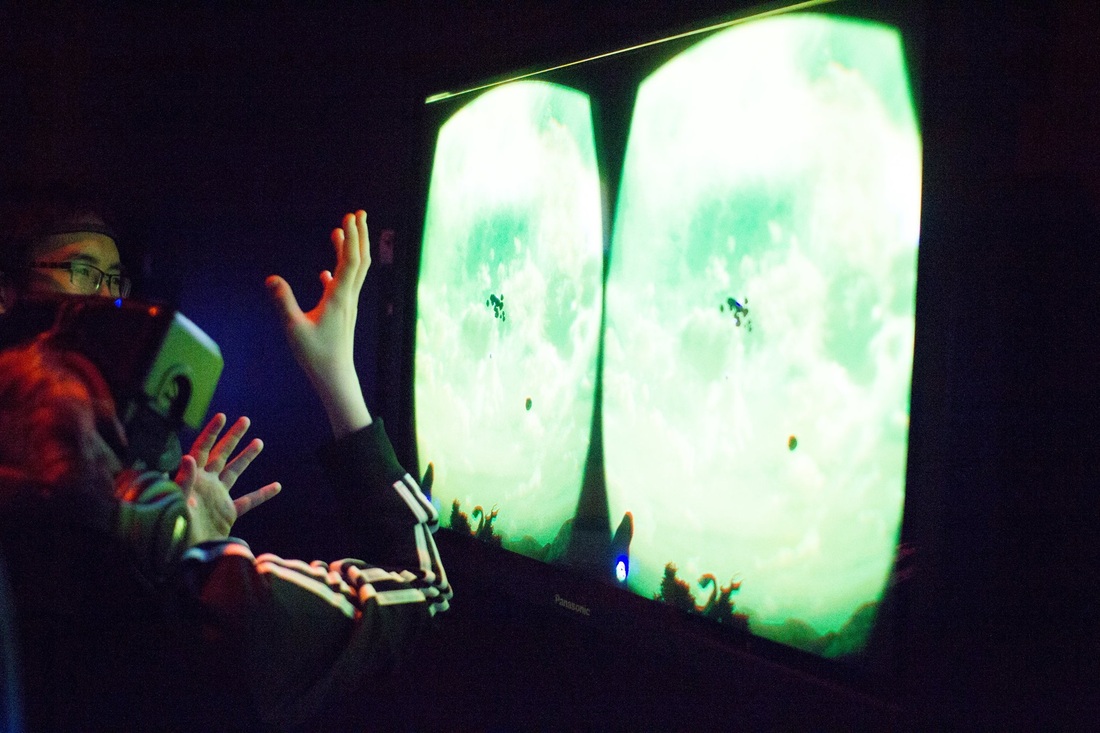
Virtual Reality-based Neurofeedback
Virtual Realty hardware enables developers to create a complete perceptual experience. The brain is easily tricked into thinking it is "really there" in the new environment, and "forgets" that the body is still standing in another room. When combined with other biosensors, VR could provide a new, engaging, and highly effective platform for neurofeedback. VR could also be used in educational settings to visually teach concepts from math and science. Imagine a 3D tour of the inside of a cell, or a 3D graph of a mathematical function! |
|
Make It Move
Pierre Karashchuk, Tomás Vega Move a robotic arm with your thoughts. In this exhibit, visitors think about moving their right and left arms, which creates a unique electrical signal in the brain picked up by an EEG cap. The patterns of activation within your brain when you move are complex, but the ‘left’ or ‘right’ signals can be consistently detected. Through repetition, we can train a computer to recognize the patterns for thinking left and right. This can send "Left" and "Right" signals to the computer, which then controls the prosthetic arm. Learn More Open-source code for the BCI signal classification algorithms and training interface: https://github.com/tomasero/mind-kinetics |
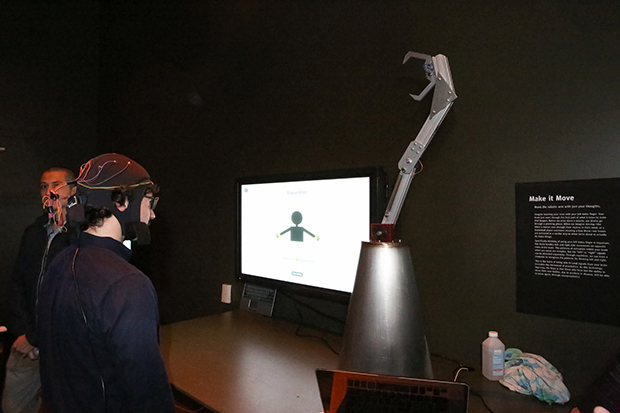
Brain-Computer Interfaces and Motor Imagery
Brain-Computer Interfaces (BCIs) are devices that translate brain activity signals into digital information that enable users to communicate with computers. Users can control their brainwave patterns by thinking about different actions or concepts. We want to explore new ways to use brain-wave reading technology to improve people’s lives. We built training interface for brain-computer interfaces, so that people with physical disabilities can use their brain activity to control a computer, a wheelchair, or other devices. This paradigm works even if the user cannot physically move those parts of their body, making it an ideal tool for people with physical disabilities. |
|
No Magic Here
Tiffany Barr, James Bobowski The "No Magic Here" sculpture communicates the power and and limitations of the Electroencephalogram (EEG) recording. The EEG headsets used in the exhibit measure the changing patterns of your brain’s electrical signals, picked up from your skin’s surface. Though the signals are faint—far fainter than those your muscles produce when you smile or squint—they can be used to detect the amount of activity in different parts of your brain, and how this activity changes because of what you are doing. This sculpture uses light to show the same idea. Looking at the sculpture from outside the skull does not allow you to see each of the lights, just as measuring electrical activity from outside the skull does not show you the firing of individual neurons. However, you can see changes in the total amount of light produced as well as changes in the frequency of light. |
Understanding EEG
Electroencephalography (EEG) is a non-invasive technique that uses electrodes on the surface of the scalp to record brain electrical activity. EEG readings show that brains differ in the kind of electrical activity they produce under various conditions. For example, waking brains show different signals than sleeping brains and healthy brains show different signals than those with certain brain-related diseases. For this reason, EEG has been especially useful in research on sleep disorders and epilepsy. EEG recordings reflect the total amount of current emitted through locations on the scalp. They inform us about the presence and volume of neural activity. |
|
Pieces of Mind
Mike Pesavento To create more accurate images of the brain, new imaging technologies are needed. In this exhibit, you can use tablets to explore 3D models of the brain’s microvasculature—the system of tiny blood vessels in the body that distribute blood to brain tissue. |
Understanding high-resolution tissue scanning
These models were created using a Knife Edge Scanning Microscope, which is able to slice tissue at the submicron scale. By taking extremely thin slices of brain tissue and scanning them one after another, a detailed 3-D image can be constructed where you can see not only the outside of the brain but the details all the way through. |
|
Puzzling Evidence
Tiffany Barr, James Bobowski, Robin Corbin, Brian Krawitz, How does concentrating on a puzzle change your mental state? Your brain works differently when you’re talking to someone than when you’re focused on solving a puzzle or thinking through a problem. In this state of total concentration you’re no longer distracted by outside thoughts, instead completely focused on the task at hand. Perception of time can also be altered, where it seems that time moves more slowly. People sometimes say that they get ‘tunnel vision,’ noticing minute details in the area they’re concentrating on while the rest of the world seems to drop away or disappear. |

Art and Cognitive Training Exercises
Researchers use puzzles like the one on the table in order to test different attention states in a quantifiable way. This kind of research crosses the boundaries of psychology and neuroscience, allowing experts from both fields to better understand the workings of the brain and improve the daily lives of patients. |
|
Save the Brain
Mike Pesavento Enter a virtual-reality reconstruction of brain vasculature, created from a real high-resolution scan of mouse cortex. You can take the role of a white blood cell in a virtual realm of microvasculature, with the goal of removing a blood clot from a blood vessel in the brain. This exhibit educates users about the architecture of the brain, the interaction between neurons and blood vessels, and the most recent advances in imaging technology for 3D tissue reconstruction. Learn More The mouse cortex in this exhibit was scanned using a “Knife Edge Scanning Microscope.” First, it slices off a very thin piece of brain tissue (only one micron thick, or 1/25,000 of an inch). It uses an optical microscope to scan the slice of tissue. After all of the brain tissue has been sliced and scanned, machine vision software will reconstruct a 3D model of the tissue and identify the areas that are blood vessels, neurons, or glial cells. Read more about at http://www.3scan.com/technology/. |
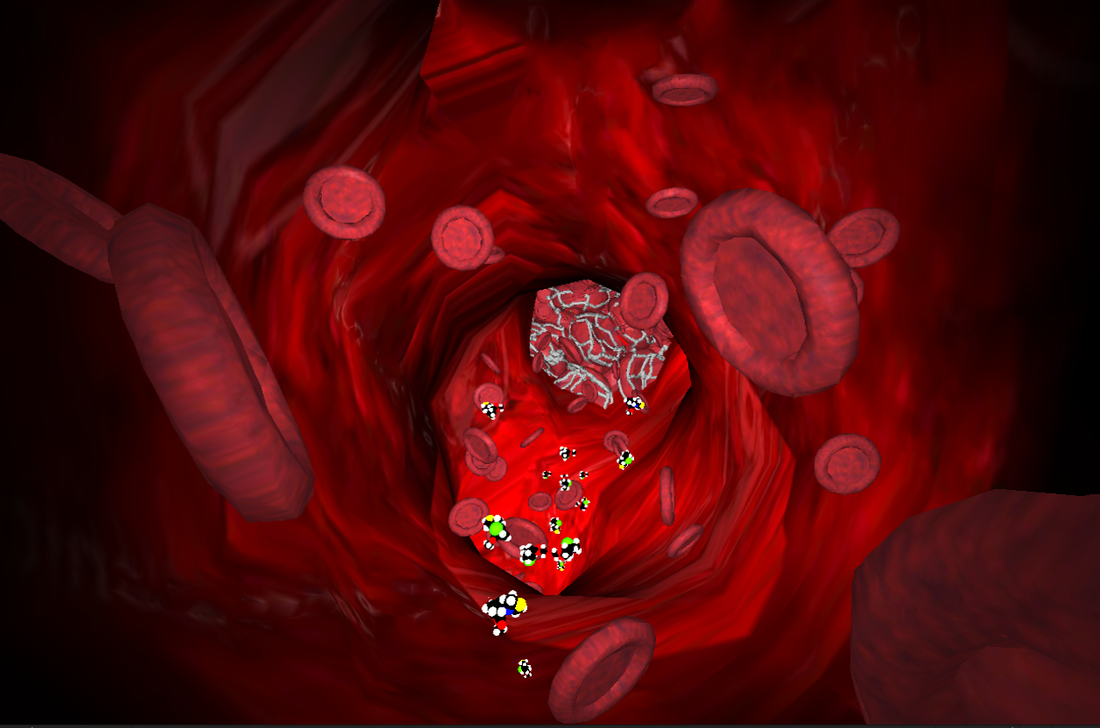
High-resolution tissue scanning and reconstruction
Thin-slicing and scanning of brain tissue can visualize the 3-dimensional structure of individual neurons, and their relationships to each other in the tissue space, showing their arrangement and possible connection structure (hence 'connectome'). This is very powerful, considering that about 100,000 neurons are packed into one square millimeter of neocortex (about the size of the tip of a pencil)! Imagine drawing a circle on a thousand sheets of transparent plastic, then stacking the sheets on top of each other. The stack of circles would look like a cylinder! By the same principle, we can reconstruct the 3D shape of the ‘cylinder’ by scanning through each of the individual sheets. |
|
The Mind’s Eye
Natalia Bilenko, James Gao A gesture-based interface for exploring 3D brain models. Use hand gestures to explore a 3D model of a brain created from functional magnetic resonance imaging (fMRI) data. The 3D model changes based on recordings from people’s brain activity as they watched a movie. Using fMRI (functional magnetic resonance imaging) researchers are able to see blood flow patterns moving through the brain. While lying in an fMRI, subjects were shown movie trailers (nature films, comedies, or dramas) that reflected the things you might see while going about your daily life. The changes in the subject’s brains were recorded and analyzed with machine learning techniques. The changes in brain activity in the visual cortex were used to reconstruct videos of what the people saw. Learn More This exhibit uses the Pycortex software, developed for interactive visualization of brain activity in the Gallant lab at UC Berkeley. This is a demonstration of brain decoding, a technique for reconstructing a person's visual experiences based on their brain responses. We combine machine learning techniques with high resolution functional magnetic resonance imaging to perform this decoding, and visualize it using computer vision algorithms. We are using the latest in WebGL and HTML5 technologies to show you the result, with LeapMotion integration to let you manipulate the brain with your own hands. Brain decoding research by Shinji Nishimoto et al.: http://gallantlab.org/publications/nishimoto-et-al-2011.html Pycortex software online: http://pycortex.org/ |

Image reconstruction from fMRI brain activity
Every thought, experience, memory, and emotion is encoded in the brain as a unique pattern of neural activity. Your everyday visual experiences translate into patterns of activity in your visual cortex. Advanced machine learning algorithms can model these patterns of activity when measured by fMRI. These models can reconstruct novel visual experiences from patterns of fMRI responses in the visual cortex. It’s important to realize that everyone’s brain is different, and even if two people look at the same picture, their brain activity patterns will be different. Thus, brain decoding is done for each person individually. |